
Horizontal Distribution of Temperature
The global distribution of temperature can well be understood by studying the temperature distribution in January and July. The temperature distribution is generally shown on the map with the help of isotherms. The Isotherms are lines joining places having equal temperature.
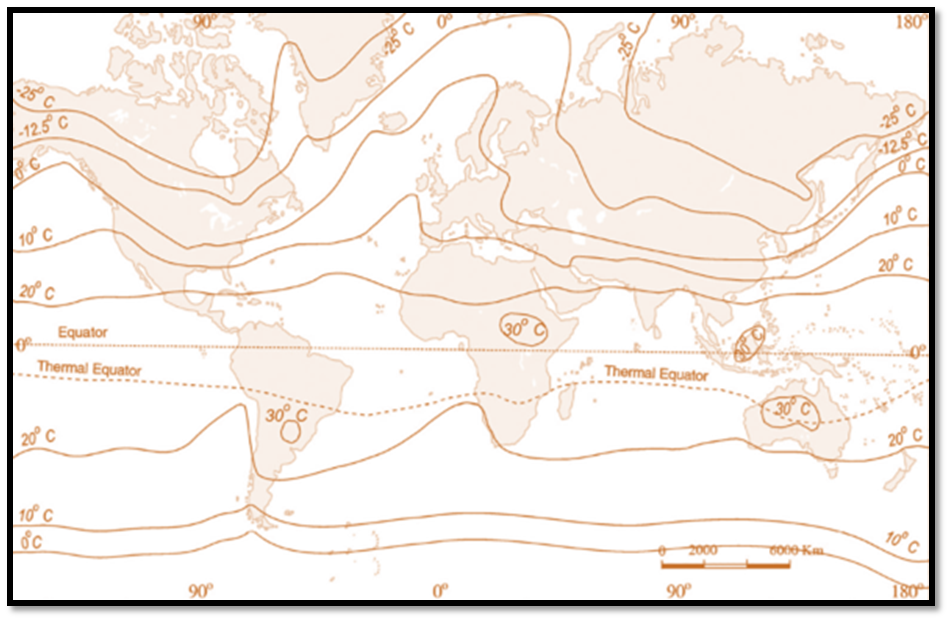
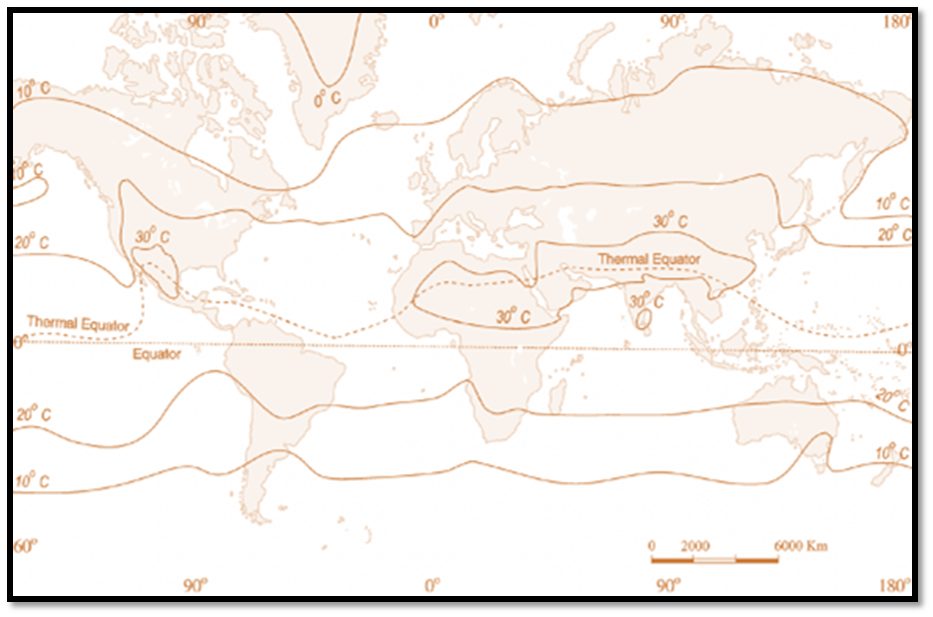
Figure (a) and (b) show the distribution of surface air temperature in the month of January and July. In general the effect of the latitude on temperature is well pronounced on the map, as the isotherms are generally parallel to the latitude.
The deviation from this general trend is more pronounced in January than in July, especially in the northern hemisphere. In the northern hemisphere the land surface area is much larger than in the southern hemisphere. Hence, the effects of land mass and the ocean currents are well pronounced.
January
֍ In January the isotherms deviate to the north over the ocean and to the south over the continent. This can be seen on the North Atlantic Ocean.
֍ The presence of warm ocean currents, Gulf Stream and North Atlantic drift, make the Northern Atlantic Ocean warmer and the isotherms bend towards the north.
֍ Over the land the temperature decreases sharply and the isotherms bend towards south in Europe. It is much pronounced in the Siberian plain.
֍ The mean January temperature along 60° E longitude is minus 20° C both at 80° N and 50° N latitudes.
Must read: Variability of Insolation at the Surface of the Earth
֍ The mean monthly temperature for January is over 27° C, in equatorial oceans over 24° C in the tropics and 2° C – 0° C in the middle latitudes and –18° C to –48° C in the Eurasian continental interior.
֍ The effect of the ocean is well pronounced in the southern hemisphere. Here the isotherms are more or less parallel to the latitudes and the variation in temperature is more gradual than in the northern hemisphere. The isotherm of 20° C, 10° C, and 0° C runs parallel to 35° S, 45° S and 60° S latitudes respectively.
July
֍ In July the isotherms generally run parallel to the latitude.
֍ The equatorial oceans record warmer temperature, more than 27°C.
֍ Over the land more than 30°C is noticed in the subtropical continental region of Asia, along the 30° N latitude.
֍ Along the 40° N runs the isotherm of 10° C and along the 40° S the temperature is 10° C.
֍ The highest range of temperature (between January and July) is more than 60° C over the north-eastern part of Eurasian continent. This is due to continentality.
֍ The least range of temperature, 3°C, is found between 20° S and 15° N.
A comparison between the January and July isotherm maps reveals the following important characteristics.
֍ The latitudinal shifting of highest temperature as a result of migration of the vertical rays of the sun.
֍ The occurance of highest values in the low latitudes and the lowest value in the high latitudes is due to the decreasing insolation from equator to the poles.
֍ In northern hemisphere the isotherms on leaving the land usually bend rather sharply towards poles in winter and towards the equator in the summer. This behaviour of the isotherms is due to the differential heating and cooling of landmasses.
֍ The continents are hotter in the summer and colder in the winter than the oceans.
Vertical Distribution of Temperature
֍ The permanent snow on high mountains, even in the tropics, indicate the decrease of temperature with altitude.
֍ Observations reveal that there is a fairly regular decrease in temperature with an increase in altitude.
֍ The average rate of temperature decrease upward in the troposphere is about 6 degree Celsius per km, extending to the tropopause. This vertical gradient of temperature is commonly referred to as the standard atmosphere or normal lapse rate, but it varies with height, season, latitude and other factors.
PRACTICE QUESTIONS
QUES . Which of the following is/are correct inference/inferences from isothermal maps in the month of january? UPSC 2024
1 . The isotherms deviate to the north over the Ocean and to the south over the continent.
2 . The presence of cold ocean currents, Gulf Stream and North Atlantic Drift make the North Atlantic Ocean colder and the isotherms bend towards the north.
Selected the answer using the code given below:
(a) 1 only
(b) 2 only
(c) Both 1 and 2
(d) Neither 1 nor 2
Ans (a) EXPLANATION: The presence of warm ocean currents, Gulf Stream and North Atlantic drift, make the Northern Atlantic Ocean warmer and the isotherms bend towards the north.